|
Biodiversity Information Science and Standards : Conference Abstract
|
|
Corresponding author: Laurens Sparrius (sparrius@floron.nl)
Received: 19 May 2019 | Published: 13 Jun 2019
© 2019 Laurens Sparrius, Dion van der Hak
This is an open access article distributed under the terms of the Creative Commons Attribution License (CC BY 4.0), which permits unrestricted use, distribution, and reproduction in any medium, provided the original author and source are credited.
Citation: Sparrius L, van der Hak D (2019) The Creation of a Climatic Map of the Flora of the Netherlands. Biodiversity Information Science and Standards 3: e36318. https://doi.org/10.3897/biss.3.36318
|
|
Abstract
In this study, a high-resolution map showing the response of wild plants to climate patterns was created by combining open data from various sources.
The first step was to estimate the average temperature in the European distribution of each plant species occurring in the Netherlands. We used GBIF observations (
The second step is to create a map that combines spatial distribution of flora with the temperature indices. The distribution of all vascular plants in the Netherlands was extracted as a 1x1 km grid from the National Database Flora en Fauna (
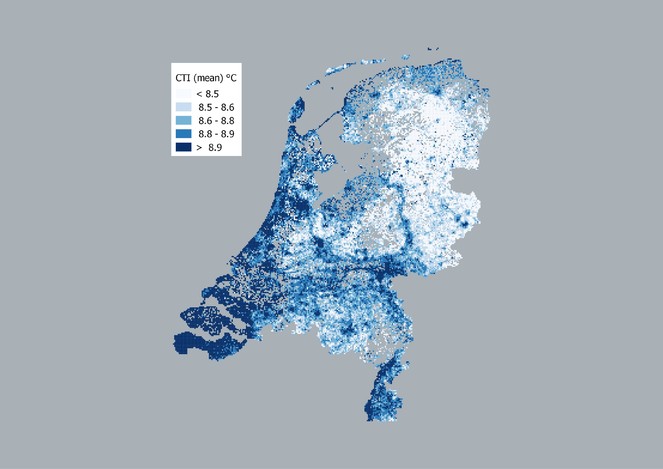
On the map several patterns are visible which can be statistically explained by the the average temperature in the country, urban heat islands, and influx of southern species along rivers (Fig.
Presenting author
Laurens B. Sparrius
References
-
WorldClim 2: new 1-km spatial resolution climate surfaces for global land areas.International Journal of Climatology37(12):4302‑4315. https://doi.org/10.1002/joc.5086
-
GBIF occurrence download. Release date:2017-3-20. URL: http://doi. org/10.15468/dl.qw9lpv
-
Vascular plant distribution data download. https://verspreidingsatlas.nl
-
An approach to calculate a Species Temperature Index for flora based on open data.Gorteria40:73‑78. URL: https://www.repository.naturalis.nl/document/667491
-
R Script for Species Temperature Index with Open Data.Zenodohttps://doi.org/10.5281/ZENODO.1155850