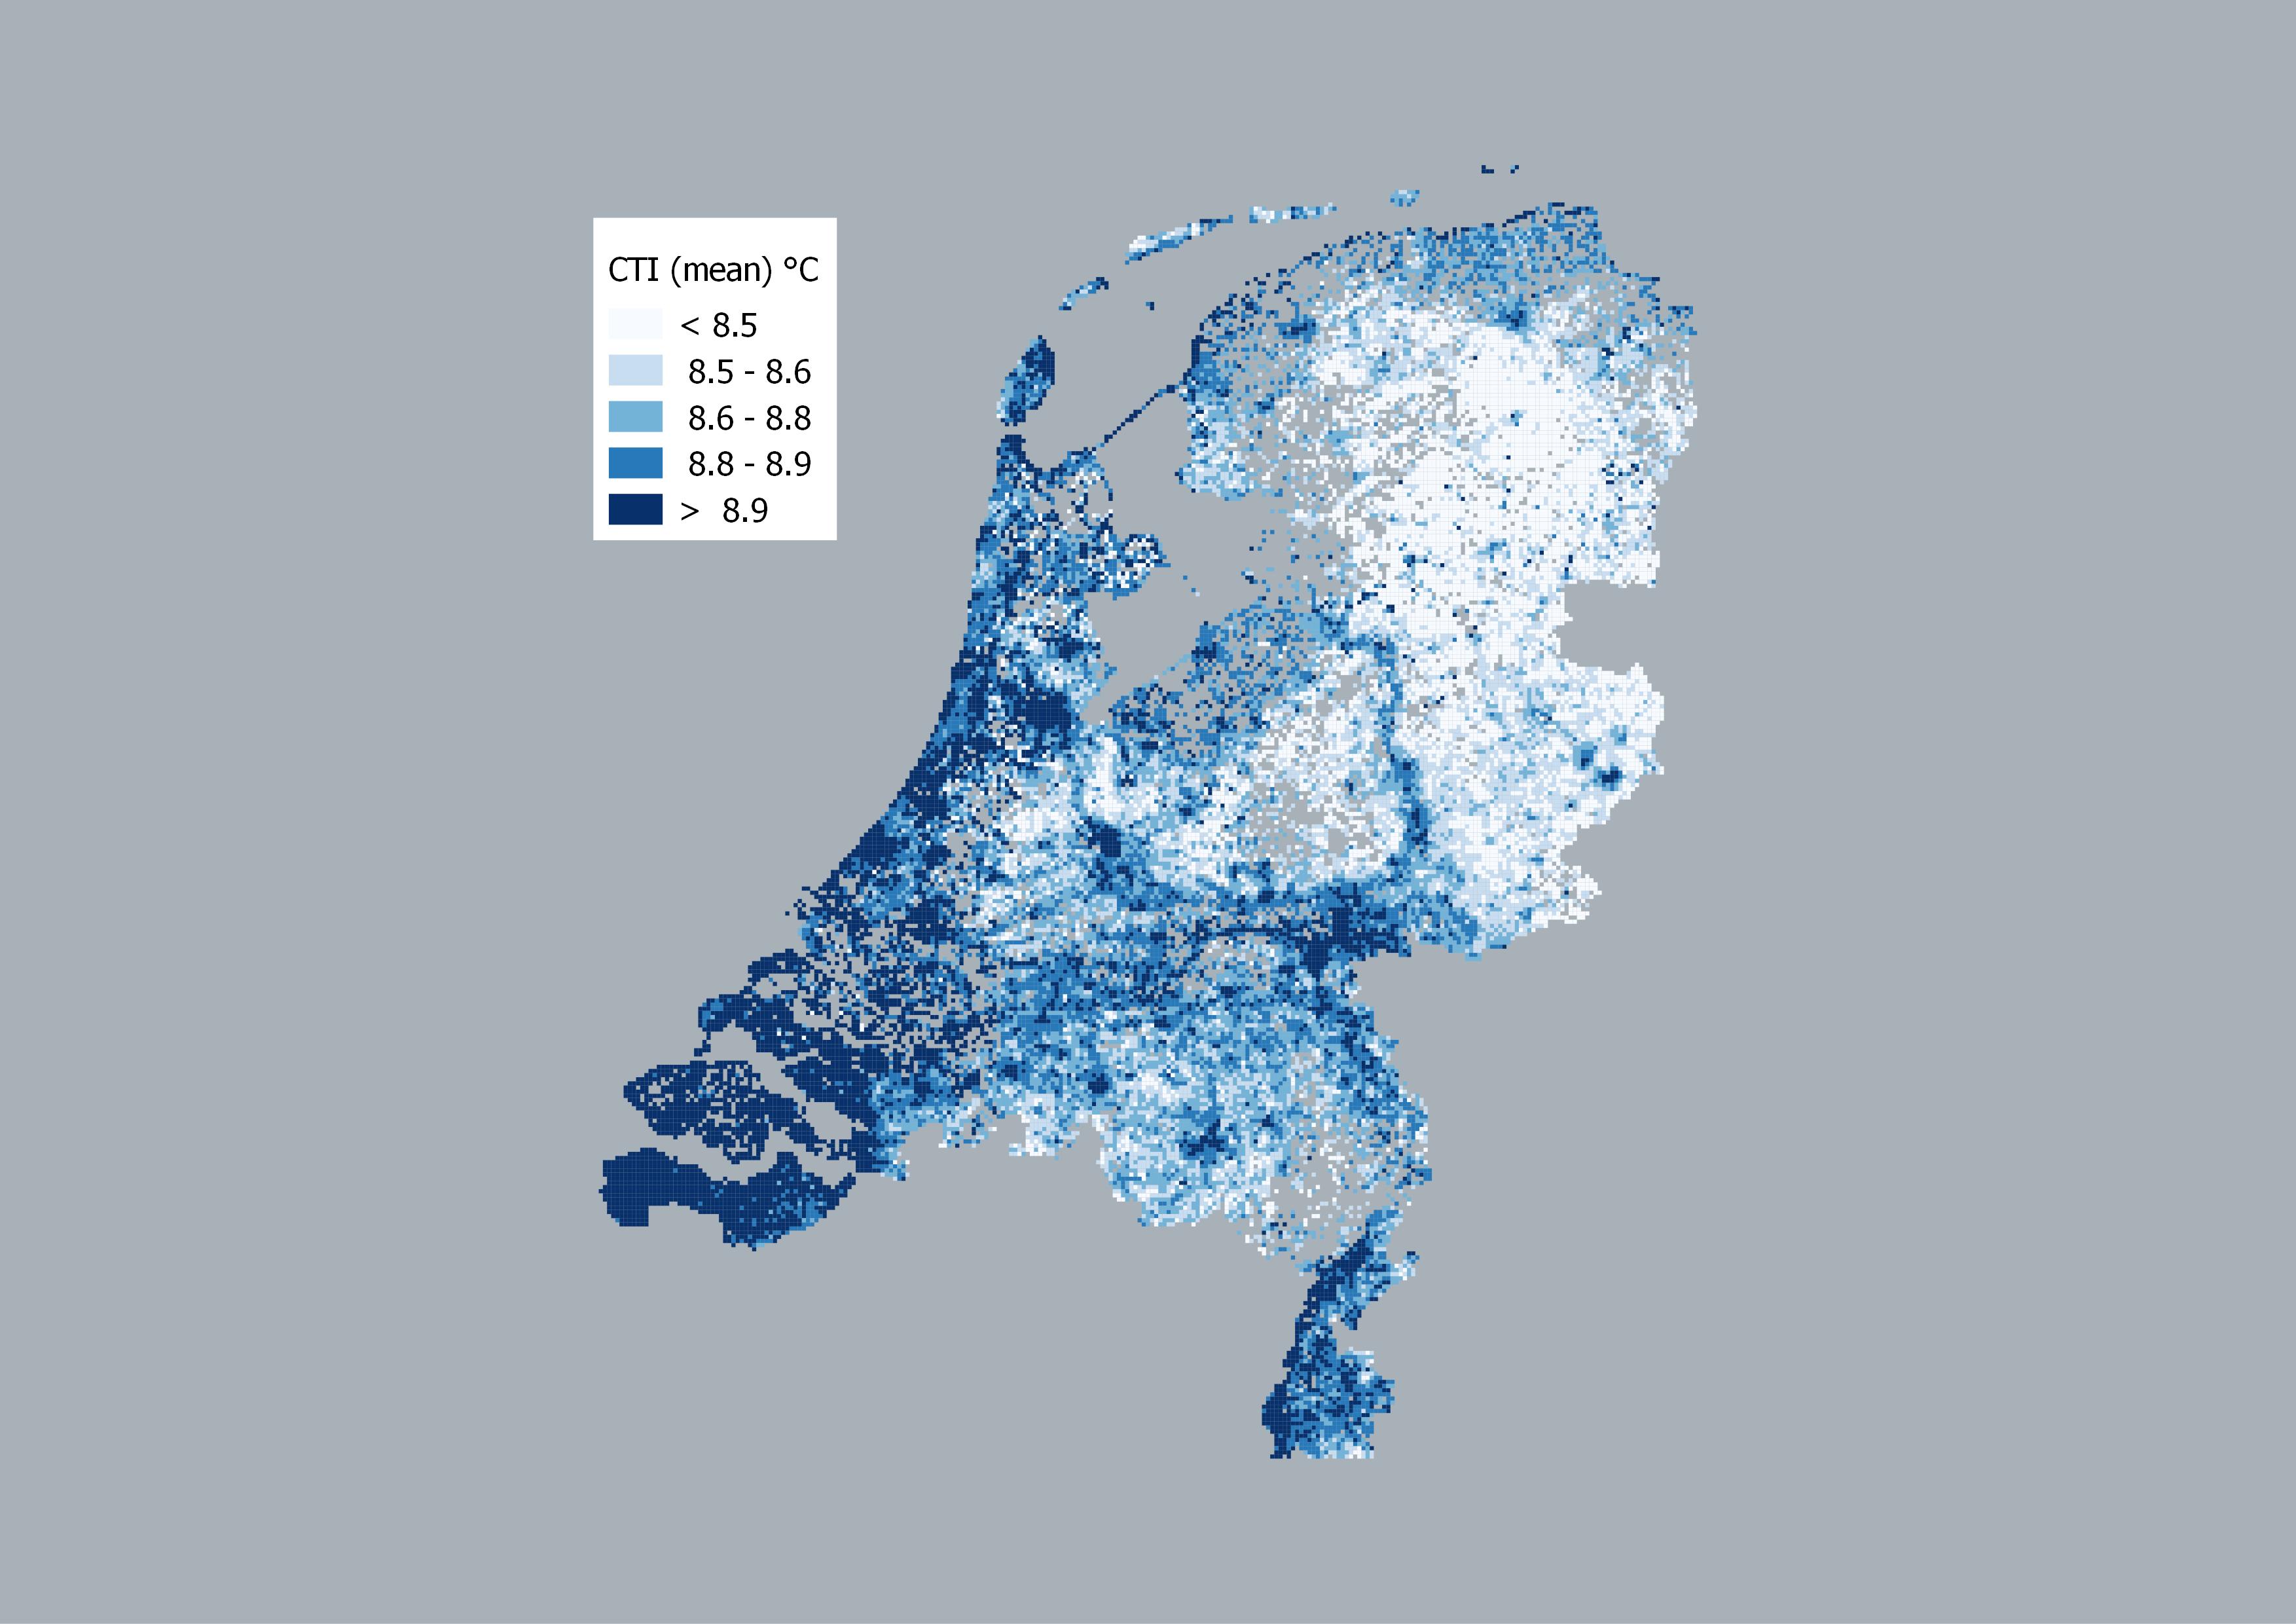
Map of the Netherlands with the Community Temperature Index (CTI) of plants expressed as the mean Species Temperature Index (STI) for all plants found in km squares. Grid squares with less than 150 species were omitted and visualized in the grey background color of the map.