|
Biodiversity Information Science and Standards : Conference Abstract
|
|
Corresponding author: Tom Strang (tom.strang@canada.ca)
Received: 30 Apr 2018 | Published: 15 Jun 2018
© 2018 Tom Strang
This is an open access article distributed under the terms of the Creative Commons Attribution License (CC BY 4.0), which permits unrestricted use, distribution, and reproduction in any medium, provided the original author and source are credited.
Citation: Strang T (2018) Developing a GIS of Hazards for Canadian Cultural Institutions. Biodiversity Information Science and Standards 2: e26305. https://doi.org/10.3897/biss.2.26305
|
|
Abstract
The Canadian Conservation Institute (CCI) has developed a Geographic Information System (GIS) of hazards for Canadian cultural heritage institutions. The greatly increased access to open data is changing how advisory bodies like the CCI and the public can access and share information.
For the purpose of investigating how a GIS approach can assist the CCI with its mandate to improve the preservation of collections, a map layer of cultural heritage institutions across Canada has been assembled and continues to be upgraded for accuracy, inclusion and detail (Fig.
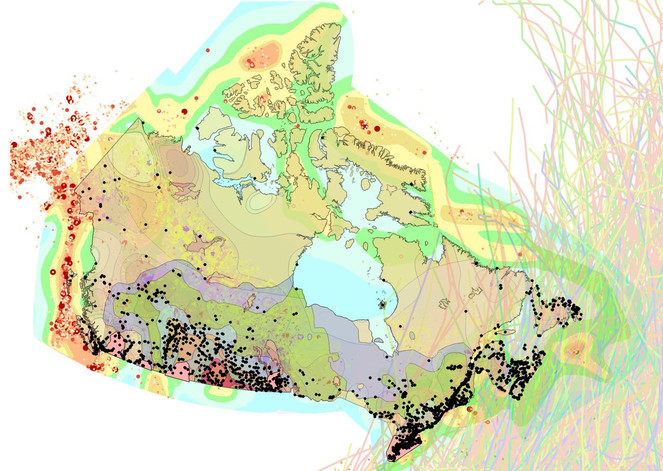
This figure shows the distribution of Canadian cultural institutions (black points) against a backdrop of seismic, hurricane, tornado, wildfire and structural pest GIS layers. As Canada spans a continent, there is strong variation in the expected likelyhood and intensity of these hazards across the population of institutions. Along with quantitative aspects of GIS, visual depiction of these ranges has good educational and interpretive value.
Sources have been drawn from federal, provincial, municipal, and academic evaluations of hazards, which now are more commonly published as GIS products. Mapping Canadian heritage institution's within a GIS improves our ability to: visualise and interpret to clients the relative magnitude of their local hazards, make ties to more refined local analyses, and show adjacencies to mapped historical events. From a national perspective the GIS can generate profiles of aggregated institutional exposure to the hazards, and more readily identify sub-populations of institutions for which particular risks would rank higher or lower among their concerns.
This improves CCI's preventive conservation advisory service's perspective on mappable risks for any institution we deal with as clients. Ultimately, through federal initiatives in open data, it is our intention that client groups can look at the GIS for the purpose of educating themselves on hazards they would want to prepare for.
Keywords
Canada, cultural heritage institution, hazard, risk, GIS
Presenting author
Tom Strang, Senior Conservation Scientist, Canadian Conservation Institute, Canadian Heritage