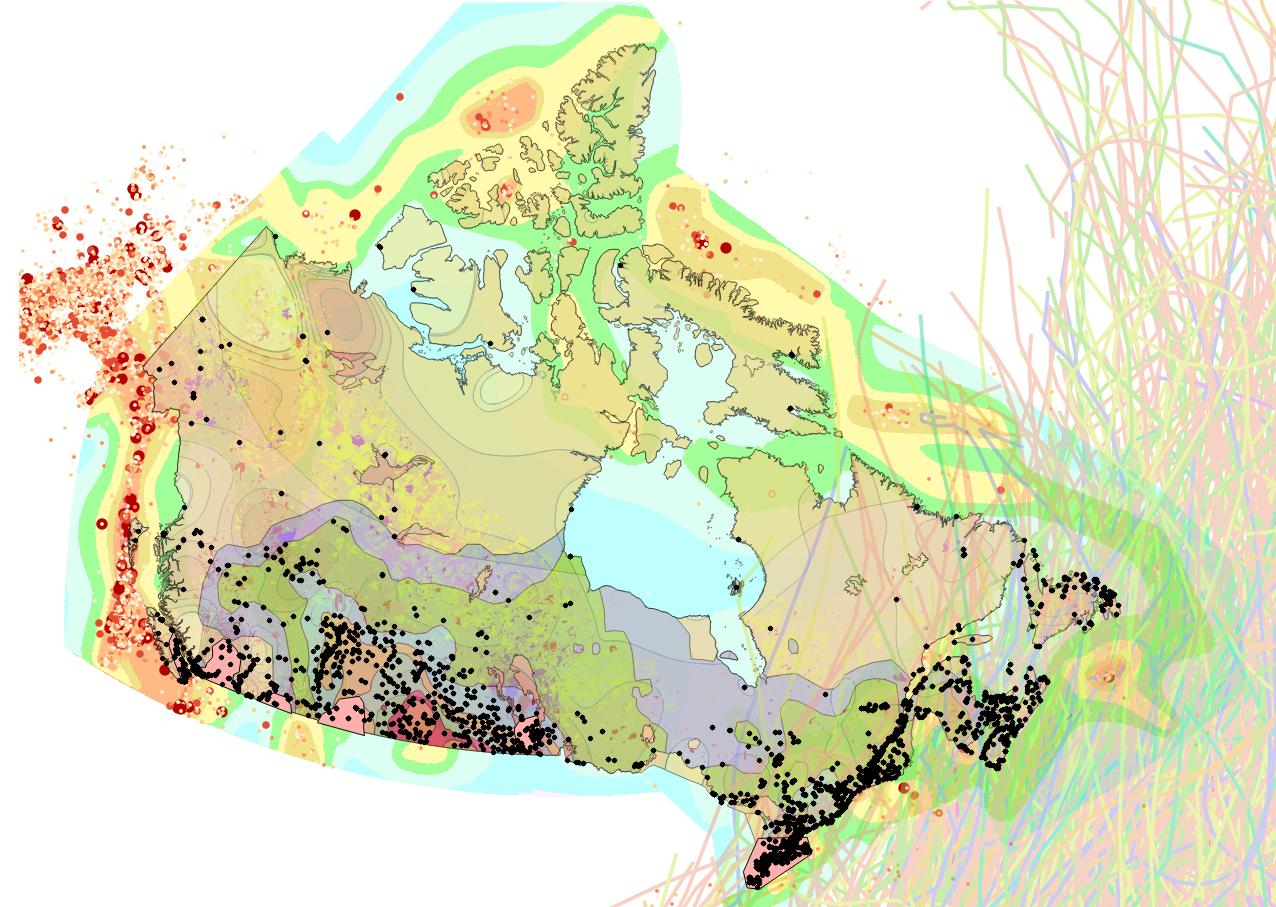
This figure shows the distribution of Canadian cultural institutions (black points) against a backdrop of seismic, hurricane, tornado, wildfire and structural pest GIS layers. As Canada spans a continent, there is strong variation in the expected likelyhood and intensity of these hazards across the population of institutions. Along with quantitative aspects of GIS, visual depiction of these ranges has good educational and interpretive value.